


Ukrainians in Italy
An overview of what is known about Ukrainians in Italy
Headline statistics
- As of 1st January 2021, there were a total of 235,953 Ukrainians in Italy
- This corresponds to 4 Ukrainians per 1,000 people
- The average age of Ukrainians in Italy is 46 (compared to 45 for all residents)
- 65% of Ukrainians in Italy aged 15 to 64 are employed (compared to 59% for all residents)
- 78% of Ukrainians in Italy are women (compared to 51% for all residents)
- 21% of employed Ukrainians in Italy aged 15 or older hold a tertiary qualification (compared to 23% for all residents)
Where do existing Ukrainian migrants live in Italy?
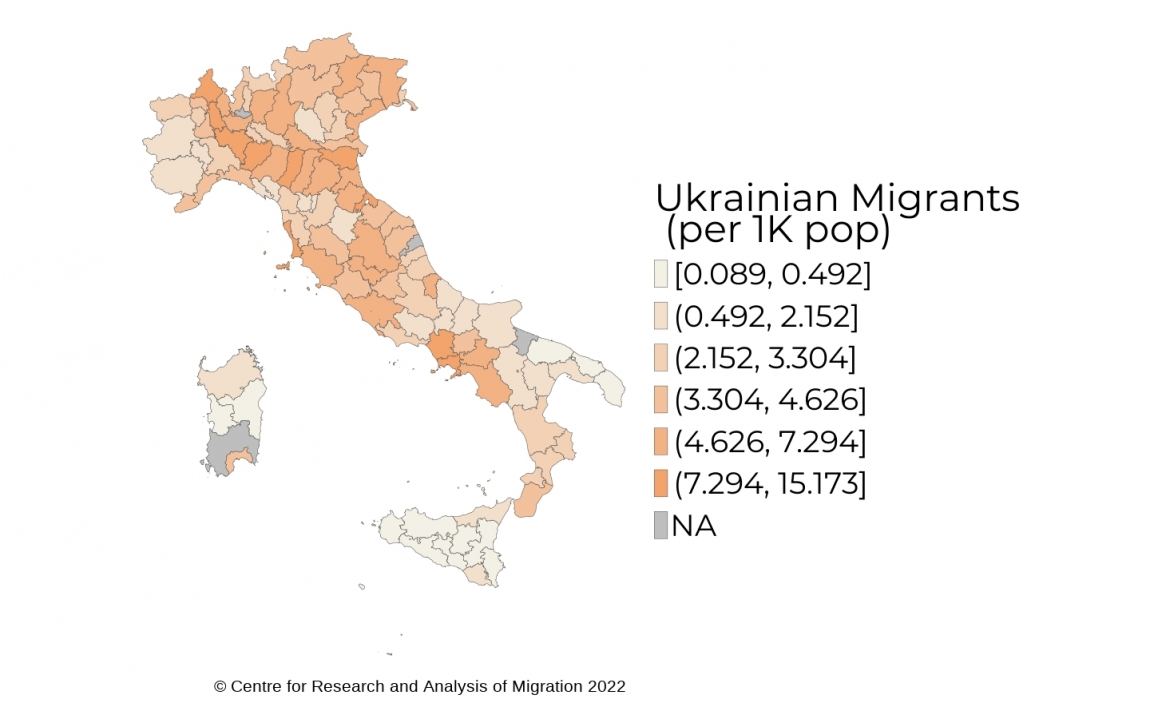
Sources and technical notes
Source: ISTAT (National Statistics) Population Database. Ukrainian migrants defined as people with Ukrainian citizenship and resident in Italy. Data at the province (NUTS-3) level as of January 1st, 2021.Most Ukrainian migrants in Italy are concentrated in the Northern regions (56%). In particular, 23% are in Lombardy and 8% in Milan. Regions of Central Italy host 20% of Ukrainian migrants (around 8% in Rome). 24% of Ukrainians are in the South of Italy, especially in the province of Naples (9%).
What do we know about Ukrainians in Italy?
Among non-EU residents in Italy, Ukrainians are the fourth largest group. As of January 1st, 2021, 235,953 Ukrainian nationals were present in the country – around 6% of all non-EU nationals.
Relative to other non-EU groups, the Ukrainian community is older, mostly composed of women and has a larger share of people with long-term residence permits in Italy.
| Ukrainian nationals | All non-EU nationals | All residents | |
| Mean age | 46 | 34 | 45 |
| % Younger than 18 | 9.1% | 22.0% | 15.8% |
| % Women | 78.6% | 49.0% | 51.3% |
| % Long-term residence permit | 76.4% | 63.1% | - |
Sources and technical notes
Source: 2020 Report on the Ukrainian Community in Italy, ISTAT. Data as of January 1st, 2020.The labour market performance of Ukrainian nationals in Italy is on average better than other immigrants. This is mostly due to better employment outcomes among Ukrainian women.
| Ukrainian nationals | All non-EU nationals | All residents | |
| Employment rate | 65.0% | 60.1% | 59.0% |
| Female employment rate | 66.5% | 46.5% | 50.1% |
| Unemployment rate | 14.3% | 13.8% | 10.0% |
| Female unemployment rate | 12.2% | 16.7% | 11.1% |
Sources and technical notes
Source: 2020 Report on the Ukrainian Community in Italy, ISTAT. Data for 2019.Ukrainian workers in Italy are on average more educated than other non-EU nationals and disproportionately employed in personal care services.
| Ukrainian nationals | All non-EU nationals | All residents | ||
| Education | % Elementary or middle school | 32.6% | 59.6% | 30.4% |
| % High school | 46.6% | 29.0% | 46.2% | |
| % College or more | 20.8% | 11.4% | 23.4% | |
| Sector | % Agriculture, forestry, fishing | 2.0% | 6.0% | 3.9% |
| % Manufacturing | 9.0% | 27.0% | 25.9% | |
| % Wholesale & retail trade | 15.0% | 24.0% | 20.4% | |
| % Transports and services to firms | 9.0% | 13.0% | 21.9% | |
| % Public & personal services | 65.0% | 30.0% | 28.0% |